How to Automate a MACD Trading Strategy With AI
Turn TradingView's built-in MACD indicator into a QQQ strategy with AI, backtest it to 2015, then automate the signals on a $1,000 paper account.

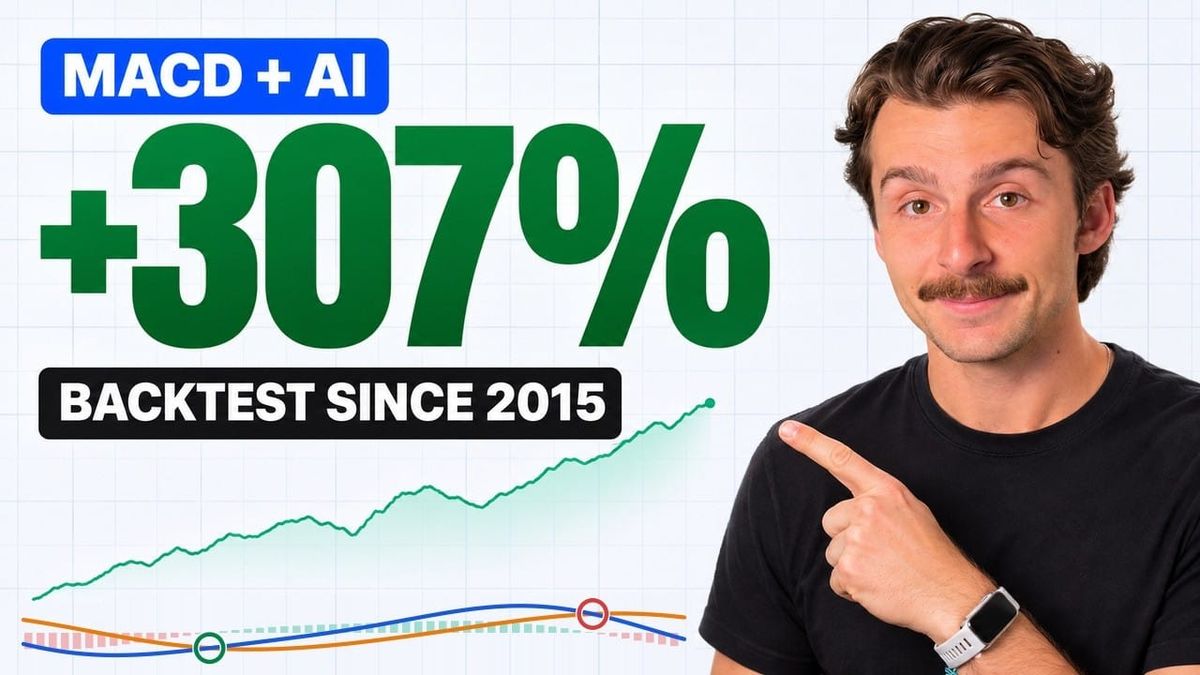
What happens if you take every MACD crossover on QQQ, on the 1-hour chart, all the way back to 2015? In this walkthrough, AI turns TradingView's built-in MACD indicator into a strategy, the default backtest comes back at +212%, and two changes — a fast length of 11 and a 2.1% stop — lift that to +307%, with a 17.18% maximum drawdown. Buying and holding QQQ still won on raw return, at about +529%, but with larger drops along the way.
This guide shows how to automate a MACD trading strategy with AI and AlphaInsider, without writing the Pine Script yourself. You will copy the official indicator source, ask Claude (or ChatGPT or Grok) to turn it into a strategy, review the backtest, then send TradingView alerts to a paper strategy so new signals can be tracked and, when you are ready, automated.
The short version: pull the MACD source from TradingView's built-in library, have AI convert it into a strategy with editable settings, backtest it on QQQ, optionally add a percentage stop, then connect a 1-hour alert to AlphaInsider and forward test before you go live.
Table of Contents
- Key Takeaways
- What a MACD Trading Strategy Actually Does
- Prerequisites: What You Will Need
- Step-by-Step Guide: Automate the MACD Trading Strategy
- Tips and Best Practices
- Common Mistakes to Avoid
- Frequently Asked Questions
- Conclusion
Key Takeaways
- A MACD trading strategy is not the same as the MACD indicator. The indicator is a momentum tool. The strategy places long and exit signals when the MACD line crosses the signal line.
- On QQQ's 1-hour chart, backtested to January 2, 2015, the default settings returned +212%, with a 24.36% maximum drawdown, profitable trades 44.27% of the time, and a 1.29 profit factor, starting from $10,000.
- Changing the fast length to 11, and leaving the slow length at 26 and the signal length at 9, produced nearly +300%, with a 25% maximum drawdown and a 1.36 profit factor.
- Adding an optional 2.1% stop lifted the backtest to +307%, cut the maximum drawdown to 17.18%, and raised the profit factor to 3.72.
- Buying and holding QQQ returned about +529% over the same period, but with larger drops: about 31% in the COVID crash, about 37% in 2022, and about 26% in the 2025 pullback.
- You can automate the signals for free on AlphaInsider by sending a TradingView webhook into a paper strategy, then forward test before connecting a broker.
- The public QQQ MACD paper strategy starts with a $1,000 balance, so new live signals can be followed separately from the historical backtest.
What a MACD Trading Strategy Actually Does
See where the blue line crosses above the orange line? That is the signal to go long QQQ. See where it crosses back below later on? That is the signal to get out.
One stretch of the chart can look clean. The better question is what happens if you simulate every one of those crossovers, on the 1-hour chart, all the way back to 2015.
MACD stands for moving average convergence divergence. On its own, it is just a momentum indicator at the bottom of the chart. It does not place trades, and it does not give you ready-made buy and sell orders. You still have to decide what to do with what you see.
The point of this tutorial is to turn that indicator into a strategy. Once it is a strategy, TradingView can mark every long and every exit, show you the simulated result, and then send those same signals out so you do not have to place the trades by hand.
Prerequisites: What You Will Need
Before you start, line up the following:
- A TradingView account, opened on Supercharts, with QQQ on the 1-hour timeframe
- Webhooks enabled on TradingView, which you will need later to send alerts out
- An AI that can write code, such as Claude, ChatGPT, or Grok. This walkthrough uses Claude
- A free AlphaInsider account, to create the paper strategy, receive the webhook, and track the trades
- An AlphaInsider API token created for TradingView, from the developer settings page
- Optional, but recommended: a plan to forward test with paper money before you connect a broker
Time estimate: the walkthrough is about 12 minutes. Most of the waiting is on the AI to write or update the Pine Script.
Skill level: beginner friendly. You do not need to know how to code. If you can copy the indicator source, paste a short prompt, and follow the settings on screen, you can do this.
Want to automate your own MACD strategy?
Create a free AlphaInsider account and forward test every TradingView signal with paper money.
Step-by-Step Guide: Automate the MACD Trading Strategy
Here is the full process, in the order it happens in the video. By the end, you can repeat it with essentially any indicator you like, not just the MACD.
Step One: Get the MACD Indicator Source in TradingView
Start from a clean chart. This walkthrough uses QQQ on the 1-hour timeframe. If an indicator is already on the chart, remove it so you are starting completely from scratch.
Do not grab MACD from the regular Indicators menu. Typing "MACD" there will add moving average convergence divergence to the chart, but it will not give you the source code. Delete it if you added it that way.
Instead, open the Pine Editor. On TradingView, that is the pine tree icon on the right-hand side. Open it, go to Create new, then go down to Built-in. That list is the official indicators and strategies TradingView already ships.
Type in MACD, but be careful. The first result is often the MACD strategy, which is not what you want here. The goal is to start from the indicator, so you can learn the same workflow with any indicator later.
Look for Moving Average Convergence Divergence, the entry without the little up and down arrows. Those arrows mark a strategy. The entry without them is the indicator. Click it, and the Pine Script opens with indicator at the top, followed by the full source.
If you do not know anything about code, that is fine. You do not have to. All you need is the official MACD source, which you are about to hand to AI.
Copy every line. On a Mac, that is Command+C.
Step Two: Turn the Indicator Into a Strategy With AI
Head over to Claude, or to ChatGPT or Grok if you prefer. Any AI that can write code will work. Paste in the source, then ask it to convert the indicator into a strategy and keep the settings editable:
"Hey Claude, can you turn this indicator that I have from TradingView into a trading strategy that actually has buy and sell signals? I want to keep all the logic the same. Just let me edit this code so I can change settings if I want to make adjustments."
Then ask it to paste the full Pine Script in the chat so you can copy it easily.
Bring that code back to TradingView. Paste it over the indicator in the Pine Editor, then click Add to chart. Minimize the editor so you can see the full chart.
Step Three: Backtest the Default MACD on QQQ
The moment you add a strategy to a TradingView chart, you get a backtest. TradingView marks the buys and sells from the code and the settings, then simulates how that would have played out.
In this case, the backtest ran to January 2, 2015, which was as far back as the chart would go here, and can be changed if you want. Starting from $10,000, the default MACD settings returned:
- +212%, or about $21,000 of profit
- 24.36% maximum drawdown
- Profitable 44.27% of the time
- A 1.29 profit factor
On the chart, every time the blue line crosses above the orange line, you now see a long. Every time it crosses back below, you see the position close, then a new long when the next cross up arrives. TradingView is simply going back through the data and adding up the result.
The first couple of years were nothing amazing, but the curve was up. By the end, a $10,000 start was up $21,000, or 212%.
To change the test itself, find the strategy, open the dropdown, and go to Settings. Under Properties, you can change the commission structure, slippage, and order sizing. A sensible habit is to add at least one tick of slippage. Then you can move over to the Inputs tab to change the MACD itself.
Step Four: Change the MACD Settings to 11/26/9
There is a very low chance that you can pull up a well-known indicator, leave the base settings alone, and just make a ton of money. The default result was already profitable, but the inputs are there to be used.
In this walkthrough, the settings were tested ahead of time to keep the video moving. The change was simple:
- Fast length (the blue line): 11
- Slow length: left at 26
- Signal length: left at 9
That produced a strategy that made nearly 300% over the same period, with a 25% maximum drawdown, a profit factor of 1.36, and a pretty solid curve.
It was not perfect. The equity curve still had some sketchy stretches, including three of the biggest corrections on the test:
- The 2020 COVID selloff
- The 2022 bear market, which lasted for most of that year
- The move at the beginning of 2025, during the tariff selloff scares
One of those drops was about 25%, which is a large maximum drawdown. Even so, that was still milder than QQQ itself over the same episodes, as the next comparison shows. It is still only one stretch of history, and the strategy could do worse in the future. That is why a stop comes next.
Step Five: Add a Percentage Stop Loss
To cut some of the downside in those corrections, go back to the AI and ask it to add a stop you can control in the settings:
"Hey, can you add a stop loss as a percentage below my entry for this strategy?"
Claude added an optional stop loss to the code, with a setting you can turn on or off and a percentage you can edit. You do not have to do this step, but it is worth doing. Copy the new script, paste it over the previous version in the Pine Editor, and click the refresh or Update on chart button. Confirm that your 11/26/9 inputs are still in place.
The new setting appeared as Use stop loss, starting at 5%. Changing it to 2%, then to 2.1%, produced a much cleaner result: over 300% in the backtest, later confirmed in the video description as +307%, with a profit factor of 3.72 and a maximum drawdown of 17.18%.
Step Six: Compare the Strategy With Buying and Holding QQQ
The improved strategy still did not beat buy and hold on total return. Over the same period, holding QQQ was up 529%. The difference is how you got there.
QQQ itself took larger hits:
- The 2025 pullback: down about 26%
- The 2022 bear market, high to low: down about 37%
- The COVID crash: down about 31%
Those are all drops of more than 30% in two of the three cases, and about 26% in the third. The stopped MACD strategy's worst drop in the backtest was 17.18%. It did not win on raw return, but it was more consistent than buying and holding.
That is a good place to stop tweaking. You can keep going if you want, but the result was already solid enough to automate and then forward test, rather than carve the settings any further around the past.
| Version | Net profit | Max drawdown | Profit factor |
|---|---|---|---|
| Default MACD settings | +212% | 24.36% | 1.29 |
| 11/26/9, no stop | Nearly +300% | 25% | 1.36 |
| 11/26/9 plus a 2.1% stop | +307% | 17.18% | 3.72 |
| Buy and hold QQQ | +529% | About 26% to 37% in the largest drops | — |
Step Seven: Create the TradingView Alert
To automate the strategy, open it from the chart, hit the dropdown, and click Add alert. Create the alert with the current conditions already set on the chart, and leave the interval at 1 hour, the same timeframe as the backtest.
Two fields matter for automation:
- The message, which you will replace
- The webhook URL, which you have to add
If the alert has nowhere to go, there is no way to automate it. That is the job of AlphaInsider, which has a feature built for this exact purpose, and you can use it for free. The only extra requirements called out in the walkthrough are webhooks enabled on TradingView and an AI subscription to do the code editing. Everything on the AlphaInsider side of this setup can be done at no cost.
Step Eight: Connect TradingView to AlphaInsider
In AlphaInsider, go to New strategy and choose TradingView. There is a setup guide with instructions on that page if you would rather follow it in writing. Otherwise, the on-screen flow is:
- Name the strategy. This one was named QQQ MACD, with 11/26/9/2.1 in the description so the settings stay attached to the name.
- Set a $1,000 starting balance, so you can watch how it trades over time without mixing that result in with the historical backtest.
- Mark it as a stock strategy on QQQ, and leave it public. The public page is linked in the video description.
- Click Create, then copy the webhook URL from AlphaInsider.
Back in the TradingView alert, paste the webhook URL, make sure the webhook option is selected, and click Apply. Then go to the message field, return to AlphaInsider, and copy the message it provides. That message already includes the strategy ID that was just created, which you can also see in the page URL. You still have to fill in three things:
- Stock ID
- Leverage
- API token, so the alert can connect to your account
To find the stock ID, go to Trade, then New order, type QQQ, select it, and copy QQQ:XNAS. That is the stock ID for QQQ. Paste it between the quotes in the message.
Leave leverage at 1. You can go up to 2, but 1 is the conservative starting point used here.
If you do not already have an API token, go to the developer settings page, click TradingView, name the token, and save it. You can reuse that same token again and again. Paste it into the message, name the alert QQQ MACD for your own reference in TradingView, click Apply, then click Create.
The alert should now show as active in the top right, on the alerts tab.
Step Nine: Forward Test the Public Paper Strategy
Go to your portfolio in AlphaInsider and scroll down. QQQ MACD should be sitting there. From this point on, when trades fire on TradingView, they get sent to that page so you can track performance over time.
That is also how you forward test the idea with live market conditions and fake money. A backtest can look really juicy and still not trade that way in real time, especially on lower TradingView timeframes, where you are not using tick data. You can run into repainting, and you can over-curve-fit the settings so they line up perfectly with the past without any guarantee about the future. Forward testing is how you check.
The public paper strategy in this video starts at $1,000, separate from the $10,000 backtest, so you can see what happens to new signals as they come in. It is public, anyone can see it, it is free, and you can set alerts on it. You can copy trade it if you want. The better first move is to follow along, confirm it is trading properly, and only then automate it.
Once you are ready, you have two options on AlphaInsider:
- Set alerts, including email and an alert in the app
- Go to Auto Trade and connect it to a broker. You can connect a paper account to test first, or connect a verified broker and have it trade automatically. Every time a trade fires on TradingView, the same trade is placed at the broker for you.
That is the full path: start with an indicator on TradingView, turn it into a strategy with AI, backtest it, then set up the automation so it can trade for you.
Tips and Best Practices
- Start from the built-in indicator, not the Indicators menu, and not the built-in MACD strategy. You need the source, and you want the workflow that works for any indicator, not just this one.
- Keep the settings editable. Ask the AI to leave the inputs in place so you can change fast length, slow length, signal length, and later the stop, without going back to the chat for every tweak.
- Add at least one tick of slippage in the strategy properties before you fall in love with a backtest number.
- Do not expect the default settings of a famous indicator to be the finished product. The default MACD test was profitable, but a single input change and a small stop improved both the return and the drawdown.
- Use the stop as a setting, not as a one-off code change. An optional percentage stop, with a toggle, makes it easy to try 5%, then 2%, then 2.1%, and see what it does to the curve.
- Stop tweaking once the result is solid. The more you change the settings to match the past, the more you risk curve fitting.
- Forward test before you automate with real money. Paper trading on AlphaInsider lets you compare live signals with the backtest.
- Start with leverage at 1, and reuse one TradingView API token instead of creating a new one every time.
- Name the strategy after the settings. "QQQ MACD" plus "11/26/9/2.1" makes it obvious later which version you are looking at.
Common Mistakes to Avoid
- Adding MACD from the Indicators search. That puts the plot on your chart, but it does not give you the source code AI needs.
- Picking the built-in MACD strategy by mistake. In the Built-in list, the strategy is the entry with the little up and down arrows. You want the indicator, titled Moving Average Convergence Divergence, without those arrows.
- Leaving the webhook out of the alert. If the alert has nowhere to be sent, there is nothing to automate.
- Forgetting the stock ID, leverage, or API token in the AlphaInsider message. The copied template already has the strategy ID, but those three fields still have to be filled in. For QQQ, the stock ID is QQQ:XNAS.
- Automating a pretty backtest on a lower timeframe without a forward test. TradingView is not using tick data there, and repainting or curve fitting can make the history look better than live trading.
- Judging the strategy only on whether it beats buy and hold. This MACD strategy did not beat QQQ's +529% return, but it did cut the largest drops meaningfully.
Frequently Asked Questions
Do I need to know how to code to automate a MACD trading strategy?
No. You copy TradingView's official MACD source, paste it into an AI such as Claude, ChatGPT, or Grok, and paste the strategy code it returns back onto the chart. You never have to write the Pine Script yourself.
Why not just use TradingView's built-in MACD strategy?
You could, but that skips the workflow this video is teaching. Starting from the indicator source is what lets you repeat the same process with essentially any indicator, not only the ones TradingView has already turned into strategies.
Did the MACD strategy beat buying and holding QQQ?
No, not on total return. With the 11/26/9 settings and a 2.1% stop, the backtest was up 307%, while holding QQQ was up about 529%. The strategy did have a milder worst drop, at 17.18%, versus QQQ drops of about 26%, 31%, and 37% in the 2025, COVID, and 2022 selloffs.
What MACD settings were used in the final backtest?
A fast length of 11, a slow length of 26, a signal length of 9, and an optional stop of 2.1% below the entry, on the QQQ 1-hour chart, backtested to January 2, 2015.
Why forward test if the backtest already looks good?
A strong historical result does not guarantee the strategy will trade that way live. That is especially true on lower TradingView timeframes, which do not use tick data, and when settings have been changed to fit the past. Forward testing with paper money is how you see whether new signals match the backtest.
What do I need to put in the TradingView alert?
A webhook URL from AlphaInsider, plus a message that includes the strategy ID, the stock ID (for QQQ, that is QQQ:XNAS), leverage, and your API token. Leave the alert interval at 1 hour if that is the timeframe you backtested.
Is it free to automate this on AlphaInsider?
The AlphaInsider side of this setup can be done for free, including the public paper strategy and the webhook connection. You do need webhooks enabled on TradingView, and an AI that can edit the Pine Script.
Can I follow or copy the public QQQ MACD strategy?
Yes. The strategy was left public, with a $1,000 paper starting balance, and the page is linked in the video description. You can view it, set alerts, or copy trade it. The recommendation in the video is to follow it first, make sure it is trading properly, and only then automate it.
Conclusion
You can automate a MACD trading strategy with AI and no coding. Copy the official TradingView indicator source, ask Claude (or another coding AI) to turn it into a strategy, backtest it on QQQ, and then decide whether a setting change or a small stop improves the curve enough to take it live.
In this walkthrough, the default MACD crossover was already up 212% from 2015. A fast length of 11 and a 2.1% stop took that to 307%, with a 17.18% maximum drawdown. It still trailed buy and hold on return, but it was the more consistent path. The last step is the one that matters after a pretty backtest: send the 1-hour alerts to a paper strategy, watch the live signals, and only automate when you have the confidence.
Ready to try the same build? Create your free AlphaInsider account, connect a TradingView webhook, and start the $1,000 paper forward test before you place a single trade by hand.